CMS Pile-up simulation
Introduction
At the LHC, many collisions occur simultaneously within one proton-proton bunch crossing. These additional interactions, beyond the "primary" interaction, from the current bunch crossing are called "in-time pileup". The detector response may be affected by pileup interactions from the current brunch crossing as well as nearby bunch crossings. The interactions from the nearby bunch crossings are called "out-of-time pileup". We need to model the additional pileup collisions in CMS simulation.
Monte Carlo simulation of pile-up is controlled by the code and configuration files in the SimGeneral/MixingModule of the CMSSW software. The simulation proceeds as follows:
-
A distribution of the mean number of interactions per bunch crossing is created for a given year of data taking, as seen below. A value chosen from this distribution is assigned as the mean number of interactions to be simulated in an event, for all bunch crossings. This value is recorded as the "true number of interactions" for the event. This sets the instantaneous luminosity to be simulated for all of the bunch crossings in that event.
-
The number of interactions per bunch crossing (in-time and out-of-time) in the event is randomly sampled from a Poisson distribution with its mean equal to the value chosen in (1). This determines how many pileup interactions are added to the simulated event. This value is recorded as the "number of pileup interactions" in the event.
Note that applying the same mean number of interactions to all the bunch crossings in an event imposes that all bunches have the same instantaneous luminosity. Neglecting bunch-to-bunch luminosity variations is a negligible effect: in practice, the spread of bunch-by-bunch luminosities is much smaller than the spread of the Poisson distribution, and the long bunch trains used in the LHC make the effect of ignoring any variations from the bunch-train structure negligibly small as well.
Pileup distributions
Measured from data
The pileup distributions measured from data are available in the CMS Luminosity information page.
Used in Monte Carlo production
The numerical contents of the estimated pileup distributions used in the MC productions can be found on this page. The distribution varies for each year. The plots below are made from the numerical values (corresponding to each year's pileup scenario) provided on that page. The x-axis of the histograms below are "mean number of interactions per bunch crossing".
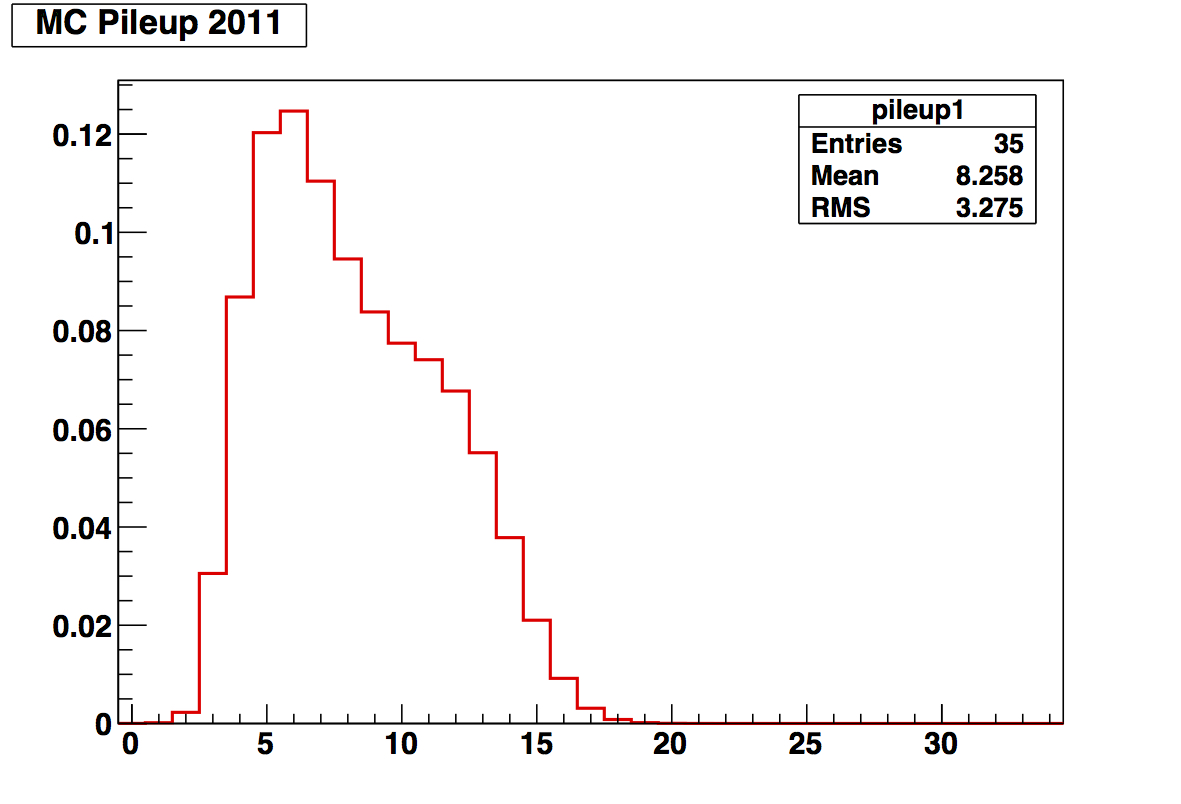
2011
For the 2011 Data, the distribution shown here was used to generate the Monte Carlo events. It is matched directly to that observed in the data for the 2011 running, so little or no reweighting should be necessary to achieve good agreement between data and simulation as far as pileup is concerned.
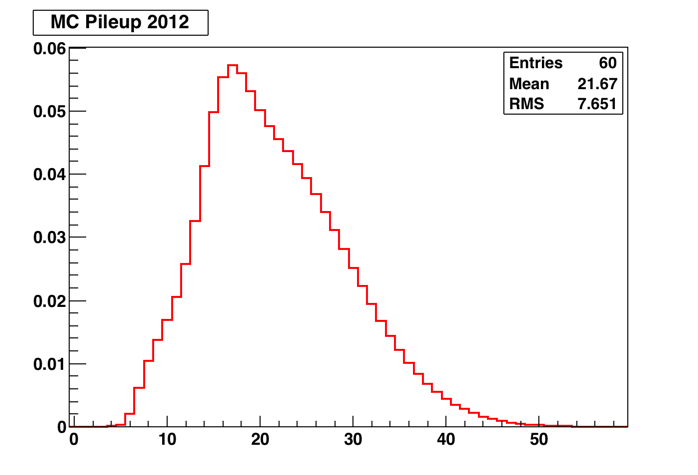
2012
For the 2012 data, the distribution shown here was used to generate the Monte Carlo events. On the webpage referenced above, this is the S10 distribution. Unlike 2011, this distribution is not an exact match to the data, so reweighting of the Monte Carlo samples is required in order to obtain good agreement.
2015
For the 2015 data, the distribution measured from the 2012 collision data, scaled by 4/5 to correspond to the estimated mean number of interactions per crossing in 2015, was used to generated the Monte Carlo events.
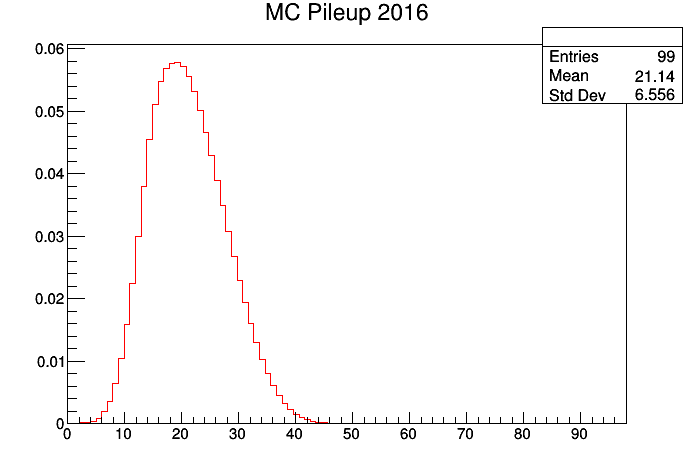
2016
For the 2016 data, the distribution shown here was used to generate the Monte Carlo events. This distribution is not an exact match to the data, so reweighting of the Monte Carlo samples is required in order to obtain good agreement.
Access Pileup Information Stored in Datasets
AOD and MiniAOD
The Monte Carlo information about pileup is available in the form of a vector of PileupSummaryInfo objects for the different bunch crossings. In AOD, the collection is addPileupInfo, which has detailed information for both in-time and out-of-time bunch crossings. In MiniAOD, the collection is called slimmedAddPileupInfo, and has been slimmed by not saving detailed information for the out-of-time bunch crossings.
The information is accessed using two functions defined in SimDataFormats/PileupSummaryInfo/ of the CMSSW software:
getTrueNumInteractions()retrieves the true mean number of the Poisson distribution, from which the number of interactions in each bunch crossing of the event has been sampled.getPU_NumInteractions()retrieves the actual number of interactions that have been added.
Here's an example of using these two functions. In an EDAnalyzer, the pileup collection can be accessed following this example. If you are unfamiliar with EDAnalyzers, check how to use an EDAnalyzer to analyze the CMS data in AOD format or in MiniAOD format first.
At the top of the EDAnalyzer's MyAnalyzer.cc file, include the pileup info header file:
#include "SimDataFormats/PileupSummaryInfo/interface/PileupSummaryInfo.h"
In the class definition of the EDanalyzer, define a "token" in the member data section:
// ----------member data ---------------------------
edm::EDGetTokenT<std::vector<PileupSummaryInfo>> PileupToken;
In the constructor function for the EDAnalyzer, set up access to the pileup collection using the token:
MyAnalyzer::MyAnalyzer(const edm::ParameterSet& iConfig)
{
  edm::InputTag PileupTag("slimmedAddPileupInfo"); // "addPileupInfo" for AOD files
  PileupToken = consumes<std::vector<PileupSummaryInfo>>(PileupTag);
}
Now, in the main analyze function of the EDAnalyzer, access the pileup info as follows:
void MyAnalyzer::analyze(const edm::Event& iEvent, const edm::EventSetup& iSetup)
{

  int NumTrueInts = -1;
  int NumPUInts = -1;

  edm::Handle<std::vector<PileupSummaryInfo>> PileupInfo;
  event.getByToken(PileupToken, PileupInfo);

  for(std::vector<PileupSummaryInfo>::const_iterator iPU = PileupInfo->begin(); iPU != PileupInfo->end(); iPU++){
    int BX = iPU->getBunchCrossing();
    if(BX == 0){ // "0" is the in-time crossing. Negative are early crossings. Positive are late.
      NumTrueInts = PVI->getTrueNumInteractions();
      NumPUInts = PVI->getPU_NumInteractions();
    }
  }
}
NanoAOD
-
The true mean number of the Poisson distribution, from which the number of interactions in each bunch crossing in the event has been sampled, is stored in the branch
Pileup_nTrueInt. -
The number of interactions that have been added to the event in the current bunch crossing is stored in the branch
Pileup_nPU.